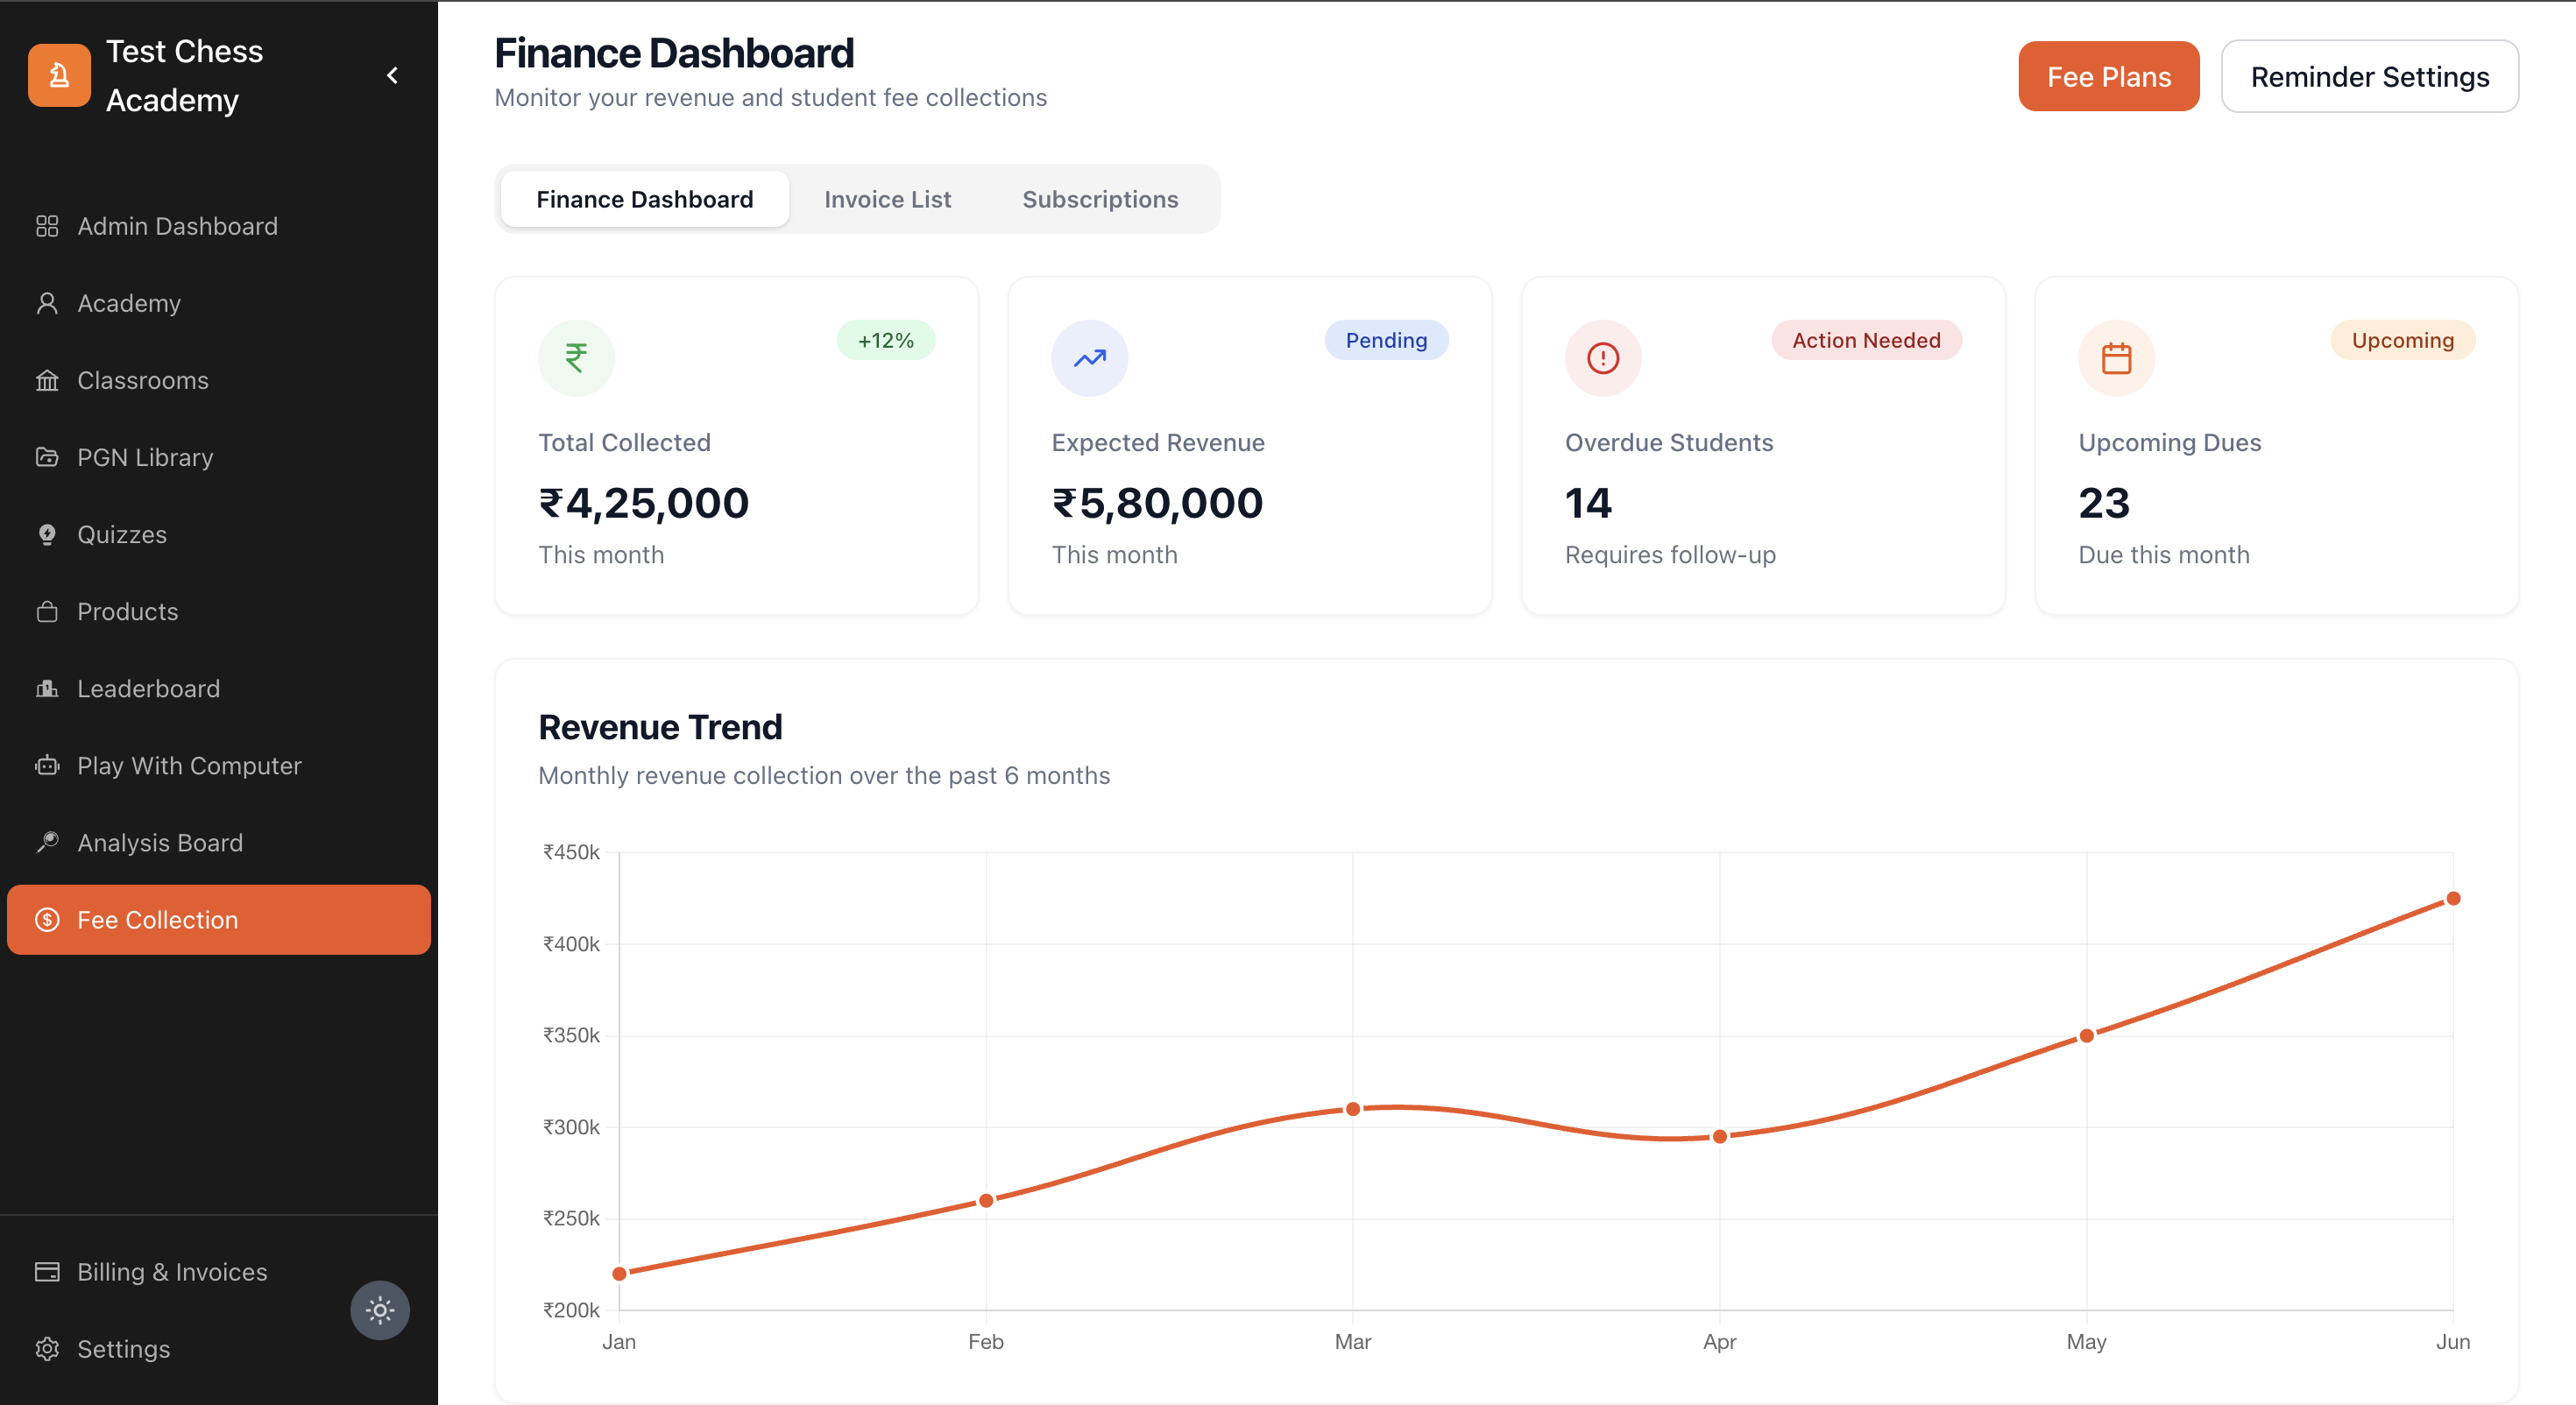
The Finance Dashboard acts as the financial command center for administrators and coaches. When you log into the platform and navigate to finances, this is the first page you see. It is designed to provide immediate clarity on the financial health of your organization, highlighting both successes (revenue collected) and areas needing attention (overdue accounts).
The Core Metric Cards
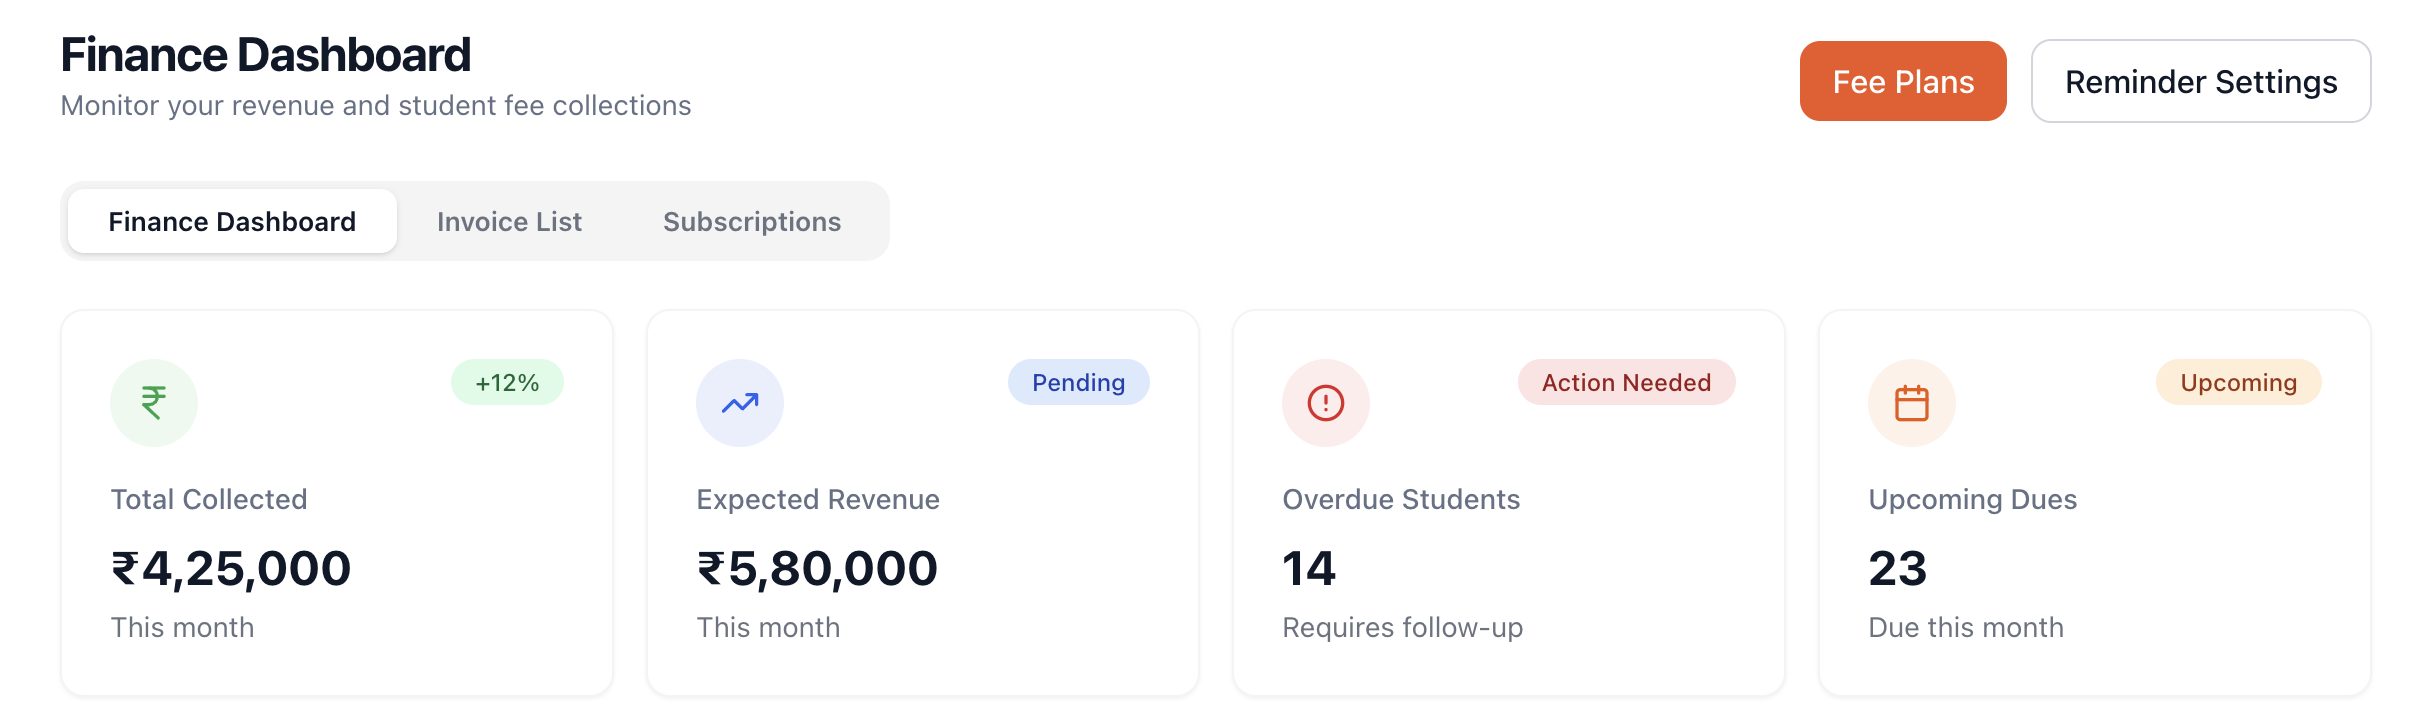
At the very top of the dashboard, four large metric cards aggregate real-time data. These cards are updated instantly as invoices are generated and payments are settled.
1. Total Collected
What it shows: The absolute total amount of money that has been successfully collected in the current calendar month.
How it calculates: This sums up all invoices—both recurring and one-time—that have transitioned to a "Paid" status (either via online payment gateways or marked as paid offline by an admin) within the current month.
Visual Cues: Displayed with a green Indian Rupee icon to indicate positive cash flow.
2. Expected Revenue
What it shows: A projection of the total revenue you should expect by the end of the current month.
How it calculates: This combines the "Total Collected" with all currently pending/unpaid invoices due this month, plus the anticipated value of active subscriptions scheduled to generate invoices later in the month.
Why it matters: It helps with financial planning and budgeting by giving you a realistic ceiling for the month's earnings.
3. Overdue Students
What it shows: The raw count of students who have at least one invoice that has passed its due date without payment.
Visual Cues: Highlighted with a red alert icon and a "Action Needed" badge.
Why it matters: This is your primary action item. A high number here indicates a breakdown in collections, prompting administrators to use the "Reminder Settings" to follow up.
4. Upcoming Dues
What it shows: The number of scheduled invoice generations or upcoming payment due dates remaining in the current month.
Visual Cues: Highlighted in orange with a calendar icon.
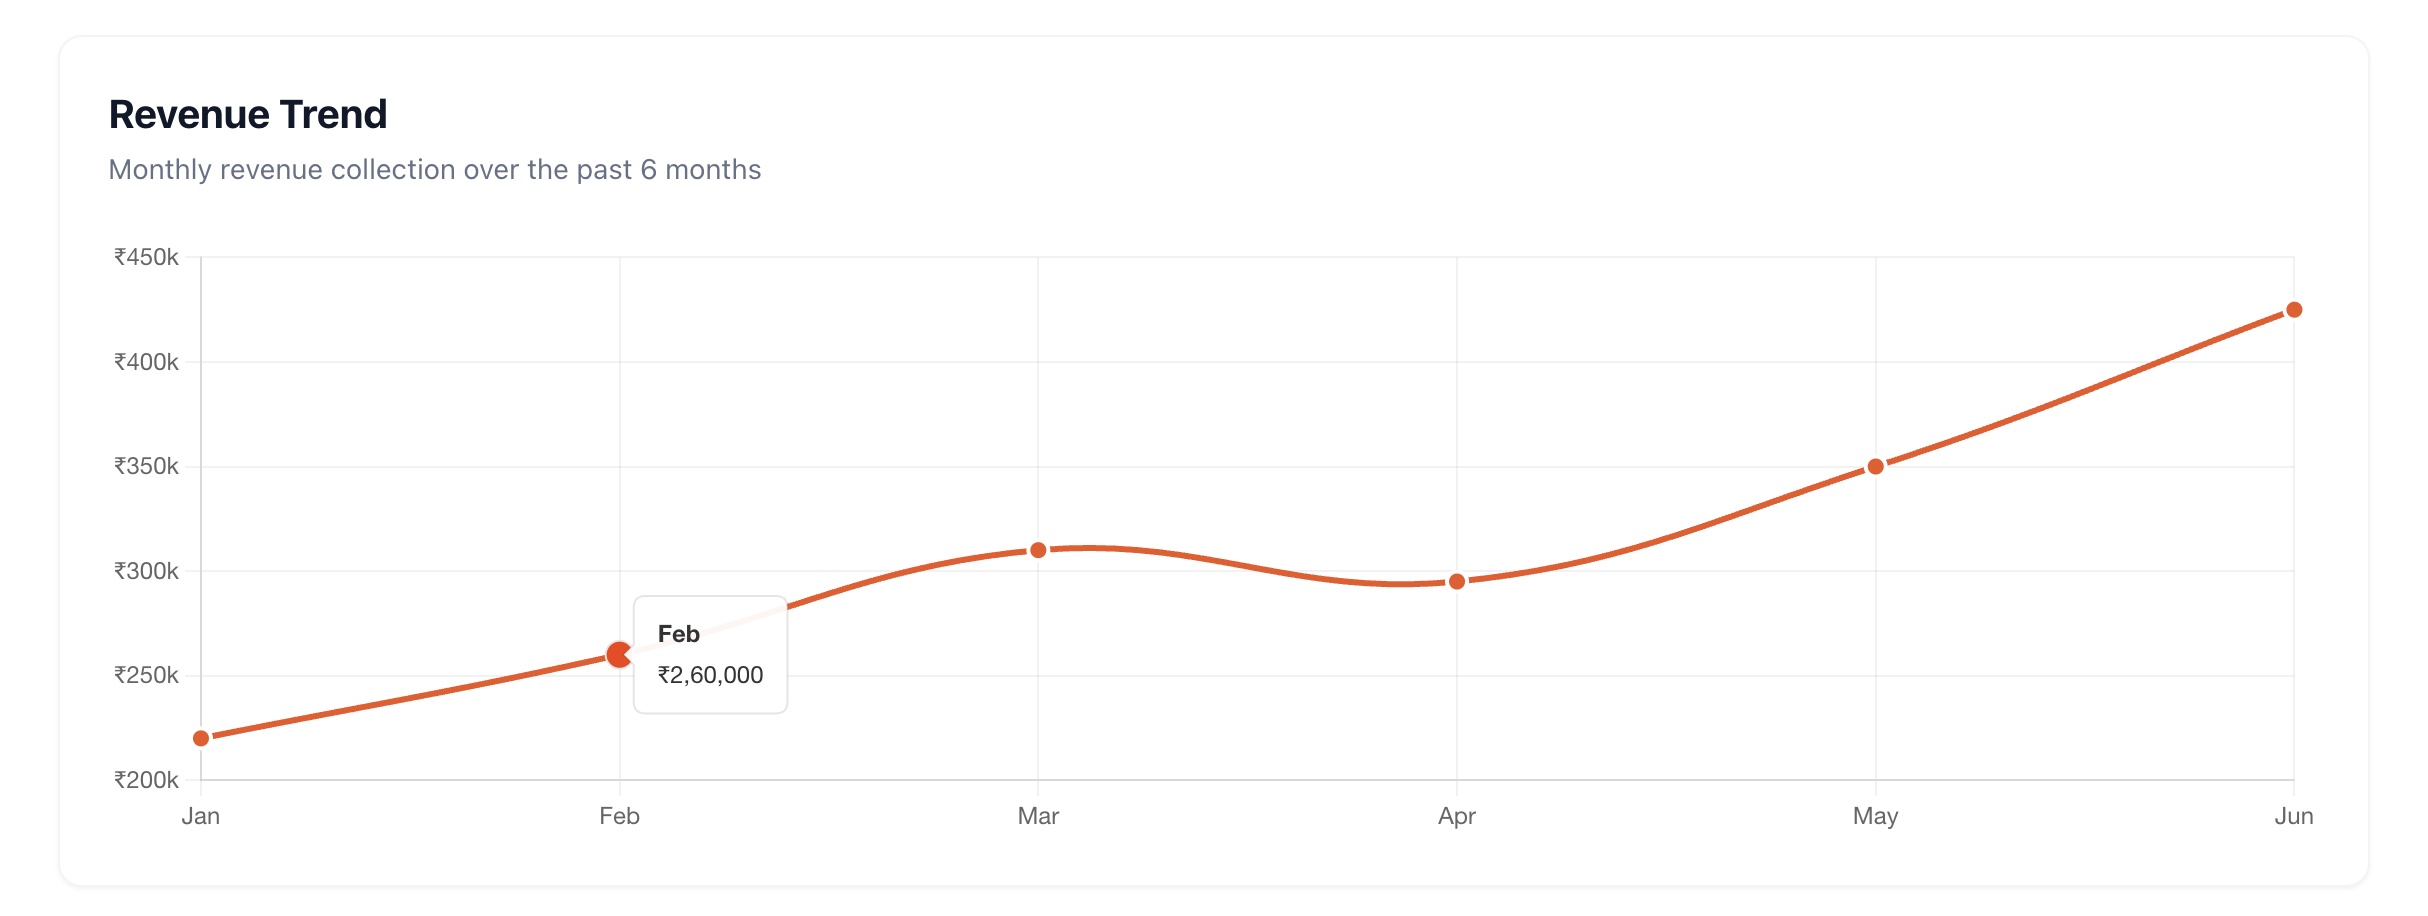
Revenue Trend Chart
Directly below the metric cards is the Revenue Trend data visualization.
Chart Breakdown
Timeframe: The chart displays data over a rolling 6-month period, up to the current month.
X-Axis: Represents the months (e.g., Jan, Feb, Mar).
Y-Axis: Represents the revenue collected in Rupees (₹).
Interactivity: Hovering over any specific month's data point will reveal a tooltip showing the exact numeric value collected during that period.
Strategic Use
This chart is invaluable for identifying seasonality in your business. For example, you might notice a spike in revenue during summer months when special tournament fees are collected, or identify a concerning downward trend in recurring collections over the last quarter.
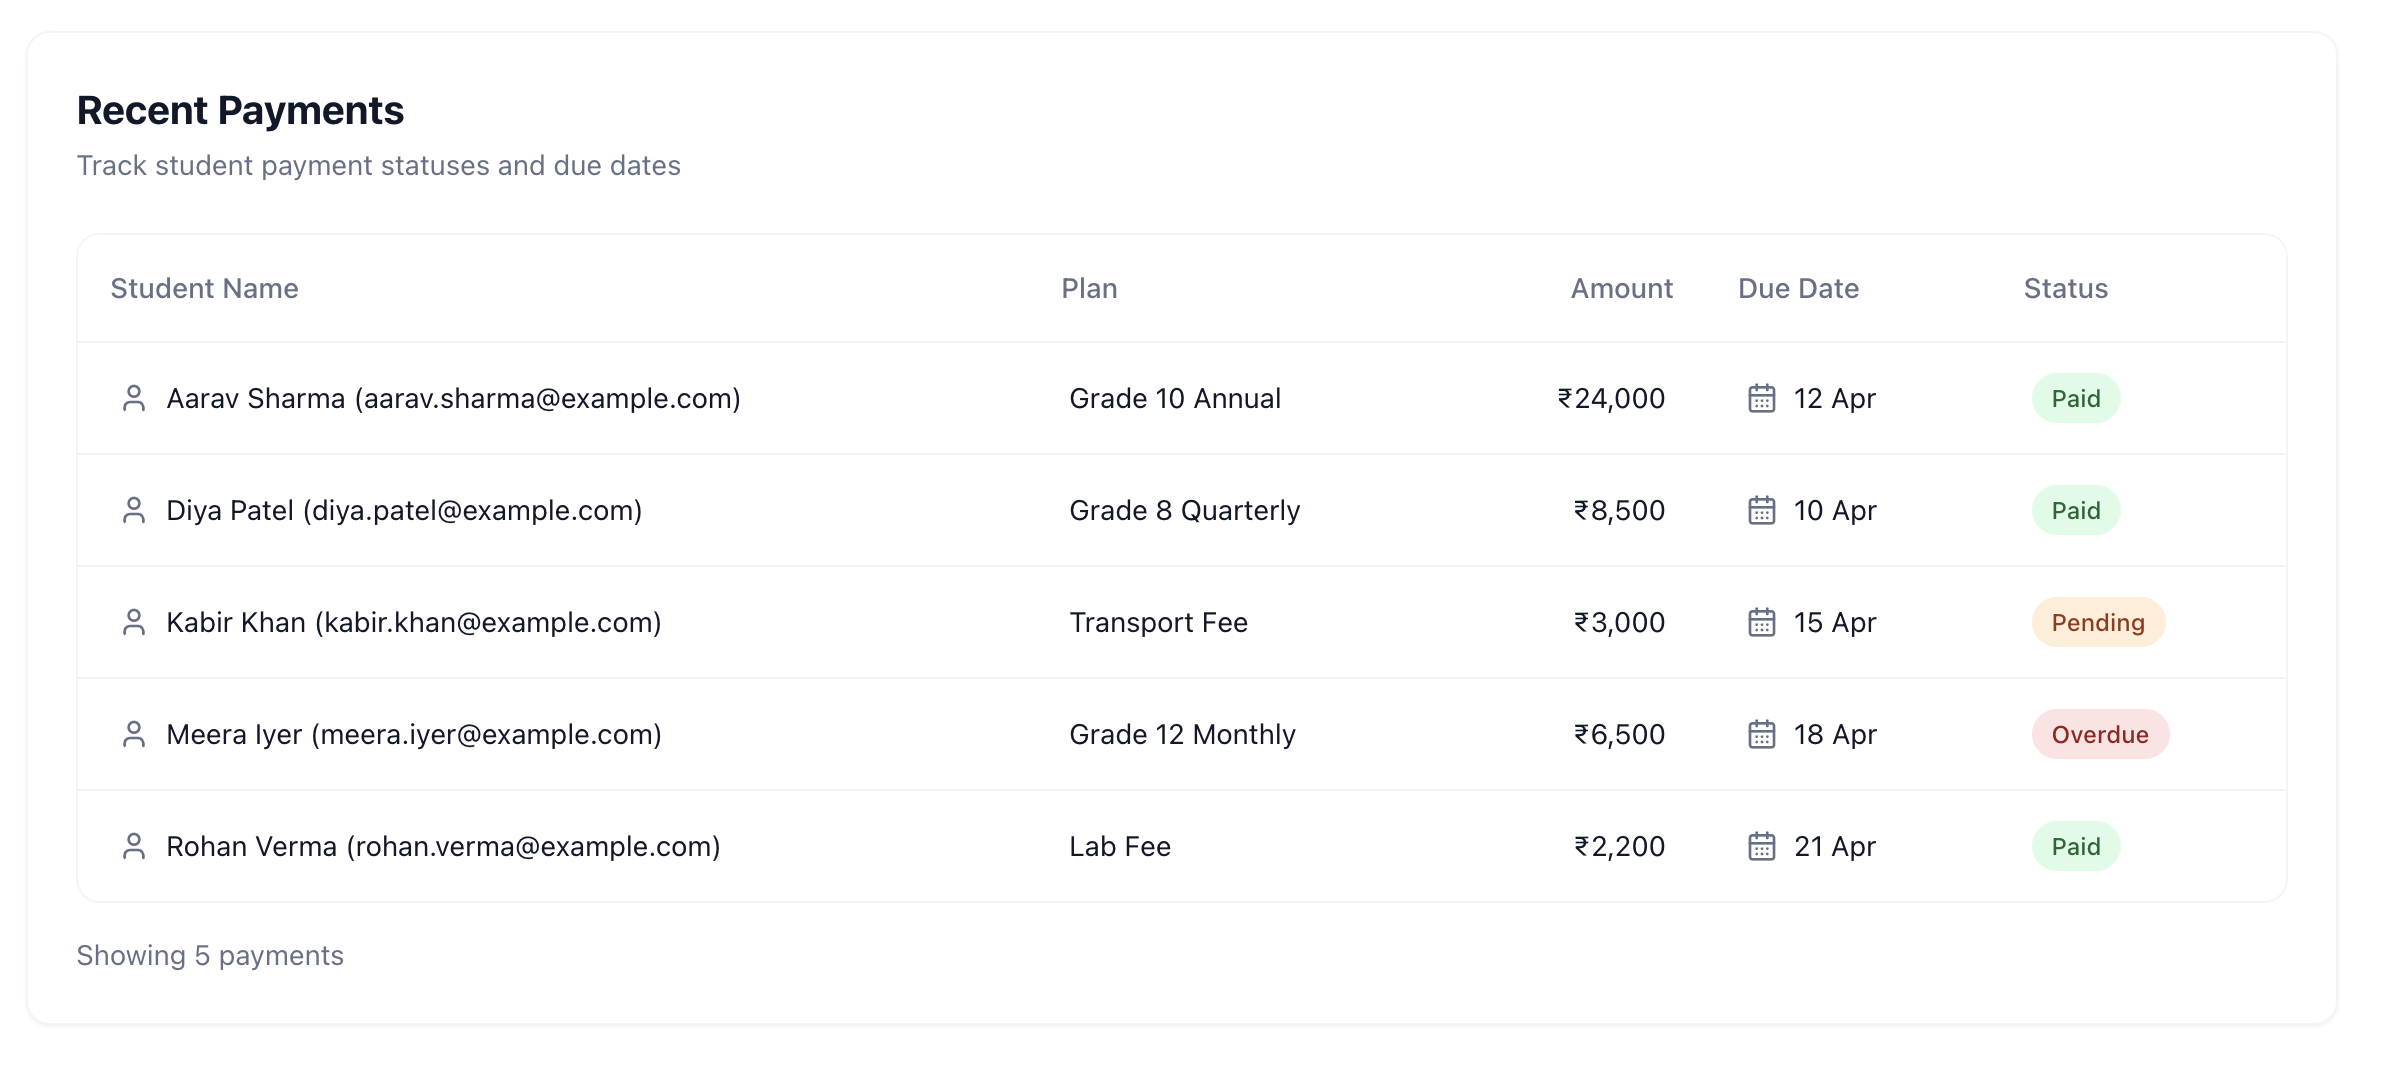
Recent Payments Ledger
The bottom half of the dashboard is dedicated to the Recent Payments table. This is a real-time, chronological feed of the latest successful financial transactions.
Information Displayed
Student Name: Identifies who made the payment, often including their email address for precise identification.
Plan: The specific Fee Plan or One-Time Fee that was settled.
Amount: The total transactional value (Base Fee + GST).
Due Date: Shows when the payment was originally due (or paid, depending on the configuration).
Status: A persistent green "Paid" badge confirming the transaction was successful.
This feed provides administrators with peace of mind. If a student claims they "just paid online," the admin can simply refresh the dashboard and look at the top of the Recent Payments table to verify the claim instantly, without needing to dig into complex banking portals.
Quick Navigation Actions
The Finance Dashboard isn't just for viewing data; it's a launching pad for financial operations. In the top right corner of the header, you will find critical action buttons:
1. Fee Plans: A direct shortcut to the engine room where pricing templates are created and managed (Detailed in the Admin Fee Plans document).
2. Reminder Settings: A crucial utility that allows admins to configure automated communication. By setting up email or SMS reminders, the system will automatically gently nudge students before their due dates, and send firmer alerts when they land in the "Overdue Students" bucket.
This dashboard ensures that administrators never have to guess about the financial status of their academy; the data is always curated, calculated, and presented clearly.